

Market Commentary
The Fab Five
Lee Adaptive Strategies Update
Monthly Commentary
October 2021
Joy and exuberance returned to the equity markets in October, with September’s losses more than made up for and the major indexes hitting new all time highs. The S&P 500 gained 7.01% on a total return basis, bringing it to up 24.04% over the first ten months of the year.
As we make the home turn into the end of 2021, this seems like a good time to reflect on what has been a remarkable few years in the market. Since the end of 2018, the S&P has almost doubled, up 97.57%. Perhaps even more impressively, and almost implausibly, it is up 46.87% since 2019, a 22-month period dominated by a global pandemic. How the pandemic drove those returns was surprising to many of us. Instead of being inspired by caution and led by such sectors as consumer staples and healthcare, the market has instead been dominated by a short list of very large capitalization growth stocks.
That the S&P has been increasingly concentrated into just a few names is hardly an original observation. We have discussed it here several times. But a longer-term perspective may be helpful. Below is the percentage of the S&P 500 accounted for by the five largest companies in the index, since January 2000.
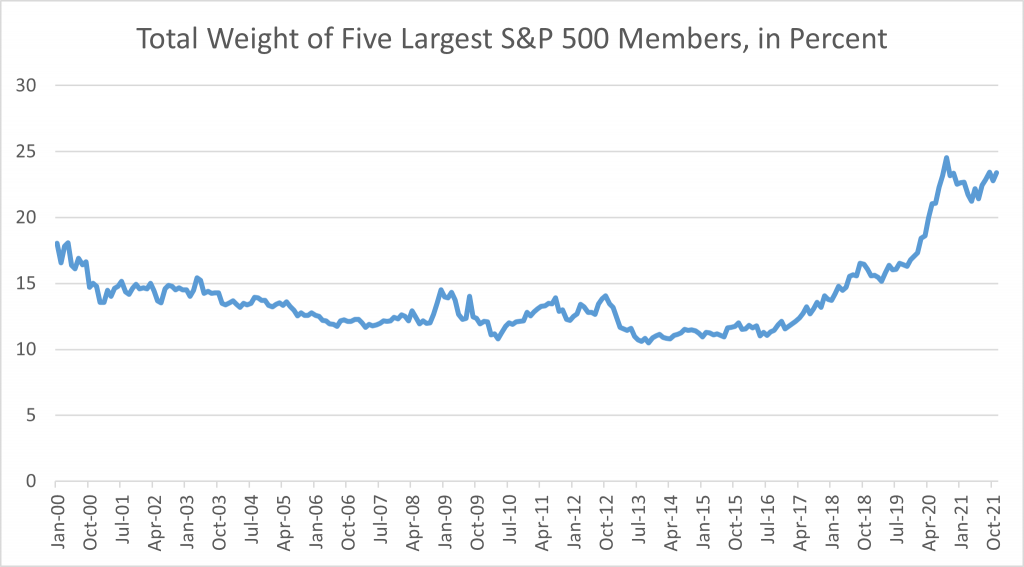
In the comparatively recent past, just six or seven years ago, the five largest accounted for about an eighth of the index. Today it is much closer to a fourth. (23.41% as of the end of October.)
And the index is now concentrated in a way that the numbers do not show. Twenty years ago, on October 31, 2001, the five largest companies in the index accounted for about 15% if it. They were Exxon, General Electric, Microsoft, Pfizer, and Wal-Mart. Each was a dominant giant in its field, but that was nearly all they had in common. A portfolio of the five would have been modestly diversified.
Today, the top five are Alphabet/Google, Amazon, Apple, Microsoft, and Tesla, which nudged out Meta/Facebook a few weeks ago. A very earnest person might argue that this list is diversified, made up of an advertising company, a retailer, a maker of cell phones, a software company, and an auto manufacturer. But we all know better. All five share a common theme. They are high-profile technology-oriented companies with familiar consumer products and celebrity founders. A portfolio of the five would be far from diversified.
And, of course, a portfolio of the five would have performed spectacularly well recently. It is hard to exaggerate the degree to which these few stocks have been driving the broader market. The chart below shows the S&P 500 on a total return basis for the past ten years, divided into the Top 5 largest companies and the remainder, the “S&P 495.” (The Top 5 and S&P 495 is rebalanced monthly.)

For the 22-month period just ended, in which the S&P 500 gained 46.87%, the S&P 495 gained 35.85%. That is still an impressive return that would thrill most investors, but without just five names the S&P would have done 11.02% worse. And that accounts only for the direct effect of the Top 5. Presumably, the increasing prices of these leaders have dragged up the prices of more mortal stocks by comparison.
Over the same 22-month period the Top 5 was up 97.57%. The five now have a combined market capitalization of $9.6 Trillion and collectively made $261 Billion in profit over twelve months ended September 30, 2021, for a price earnings multiple of 36.8.
Predicting the future is always very difficult, particularly when current circumstances are so unique. But something modestly similar happened at the very start of this century, at the height of what was afterwards named the Dot-Com Bubble.
On March 31, 2000, the Top 5 made up 17.83% of the S&P 500. It included Cisco, General Electric, Intel, Microsoft, and Qualcomm. That is four tech companies and a conglomerate with a then celebrity CEO and an unlikely cult following among investors.
Microsoft is still in the Top 5. And the other four? Did something terrible happen to them? Not really. GE has had some challenges recently, but overall, all four are alive and well, large, successful, and profitable. What happened was that investors gradually fell out of love with them, and their valuations came back down to Earth.
Over the 18 months that began March 31, 2000, the S&P 500 declined -29.26%, while the Top 5 lost -40.38%. By September 2001, the Top 5 no longer included Cisco, Intel, and Qualcomm. They were replaced by Citigroup, Exxon, and Pfizer.
The Market Sentiment Framework

We use our Market Sentiment Framework to adapt the mechanics and weightings of our full quantitative models to changing market conditions.
The Sentiment Framework gauges the current state of market psychology on two dimensions. Efficiency measures the crowdedness of the market, the volume of participants seeking investment opportunities. Lower levels of efficiency imply more market mispricing. Optimism measures the willingness of investors to take on risk in exchange for distant anduncertain rewards. Higher levels of optimism imply a better outlook for risky asset classes.
Both the Optimism and Efficiency levels were nearly unchanged in October.
Optimism began the month at 0.20 and ended at 0.09. Although still relatively low in absolute terms, Optimism is well above its pandemic lows and not that far from its post-COVID high of 0.70 seen in mid-April of this year.
Efficiency fell slightly, starting the month at -0.26 and ending at -0.41. Efficiency continues to be comparatively low as compared to historical averages, which suggests a market that is still under stress, and indeed increasingly so.
Both measures are higher than where they were in early 2020, but have trended lower since the spring. The current positioning of the Sentiment Framework implies a market that is functioning less than ideally, with modestly optimistic but still fearful investors. This would imply a positive but challenged outlook for the market as a whole, but possibly an opening for value strategies to find opportunities.
Disclaimer:
PAST PERFORMANCE IS NO GUARANTEE OF FUTURE RESULTS OR PROFITABILITY.
The above is the opinion of the author and should not be relied upon as investment advice or a forecast of the future. It is not a recommendation, offer or solicitation to buy or sell any securities or implement any investment strategy. It is for informational purposes only. The above statistics, data, anecdotes, and opinions of others are assumed to be true and accurate however 3D/L Capital Management does not warrant the accuracy of any of these. There is also no assurance that any of the above are all-inclusive or complete.
3D/L does not approve or otherwise endorse the information contained in links to third-party sources. 3D/L is not affiliated with the providers of third-party information and is not responsible for the accuracy of the information contained therein.
Past performance is no guarantee of future results. None of the services offered by 3D/L Capital Management are insured by the FDIC and the reader is reminded that all investments contain risk. The opinions offered above are as of October 31, 2021 and are subject to change as influencing factors change.
More detail regarding 3D/L Capital Management, its products, services, personnel, fees, and investment methodologies are available in the firm’s Form ADV Part 2A or by calling (860) 291-1998, option 2 or emailing sales@3dlfinancial.com or visiting 3D/L’s website at www.3dlfinancial.com
By: Nathan Eigerman